# Bias Variance Trade-off
> If you torture the data long enough, it will confess to anything - Ronald Coase
## Overview
The **bias-variance trade-off** helps us understand the concepts of models over-fitting and under-fitting the training data [1].
## Definition
The usual definition of the Bias-Variance decomposition is [2]:
E[(ŷ - y)^2] = E[(ŷ - E[ŷ])^2] + (E[ŷ] - y)^2
MSE = Variance + Bias^2
Mean Squared Error (MSE) = How far is the model from ground truth
MSE = How far is the model from ground truth
Variance = How far is the model from average model
Bias = How far is the average model from ground truth
----------
There are two main sources of error for a model in a supervised setting [2]:
- **Bias:** the difference between the expected value and true value of the learning algorithm.
Bias is the error computed using the training data and trained model.
A high bias will make the algorithm miss the relevant relationships between the features and the target which is called _underfitting_.
- **Variance:** the error due to sensitivity to small fluctuations in the training data.
Variance is the error computed using the test data and trained model.
A high variance will make the algorithm model the random noise of the training data which is called _overfitting_.
Ideally, we want to find the sweet spot where the sum of these two components is minimized (low bias and low variance) which will give us the best performing model.
## Bias Variance Decomposition
The MSE error can be decomposed into two terms: bias and variance [1].
For the derivation, f(x) will be represented as f and f̂(x) as f̂.
### Bias
The _bias_ measures the difference between the estimator’s expected value and the true value value of the parameter being estimated [1] and [2]
b(f̂) = E(f̂)- f
### Variance
The _variance_ of a random variable is the expected value of the square of the difference of the random variable from its expected value [1] and [2].
Var(f) = E[(f - E(f))²]
Thus, variance is the mean squared deviation of a random variable from its own mean.
A high variance would mean that the observed values of X will be **farther away from the mean** and vice versa.
## Searching for the Optimal Estimator
Searching for optimal estimators usually requires an optimality criterion [1].
For DL/ML models, the criterion is the loss function [1].
There are several loss functions that are available out there and the choice of the function depends on the problem you are trying to solve (classification, regression, segmentation, etc.).
Mean squared error (MSE) is perhaps the most common and is defined as follows.
The MSE of the estimated function is the expectation of the square of the difference of the estimated function from the actual function.
MSE measures the average mean squared deviation of the estimator from the true value which has a nice convex surface — it is curved upwards and has only one optimum. Therefore, it is well suited for a wide range of optimization techniques.
In summary, _bias_ is the difference between the expected value of the estimator and the actual underlying function (true value) and _variance_ is the variability of the model [1].
## Bias and Variance in Neural Network
In the case of deep learning, the networks work as powerful estimators without having any explicit definition [1].
Let us see what would happen if we add some noise to the random process because observations Y for a random process always contain some inherent noise [1].
E[(ŷ - y)^2] = Bias^2(ŷ) + Var(ŷ) + σ²
where the σ² term represents _Bayes Error_ which can be represented as follows [1]:
Total Error = Bias + Variance + Bayes Error
_Bayes error_ refers to the lowest possible error for any classifier and is analogous to irreducible error which is also known as the optimal error.
Even if you build a perfect model, this error cannot be eliminated since the training data itself is not perfect but contains noise.
Thus, the total error for your model is the addition of three kinds of errors [1]:
- Error due to bias in the model
- Error due to the model variance
- Irreducible error (Bayes Error)
----------
The processing done by a neuron can be denoted as [3]:
output = Σ (weights * inputs) + bias
Thus, _bias_ is the difference between the observed value and the predicted value.
The bias terms allow us to shift the neuron’s activation outputs left and right which helps to model datasets that do not pass through the origin.
### What is Bias
In the figure, you can see that that the training error (blue dotted line) keeps on decreasing. In the initial phase, it is too high (High Bias) then later it decreases (Low Bias) [3].
High Bias means the model is not fitting the training data [3].
### How to lower the bias
- Increase the number of epochs (iterations)
- Try a Bigger network
### What is Variance
The variance of a model is the difference between validation error and training error.
In the figure, you can see that the gap between validation error and training error is increasing while the variance is increasing (overfitting).
Variance gives us the information about the generalization power of our model.
- If the Variance is high, the model is not performing well on the validation set.
- We always want a low variance.
### How to lower the variance
- Increase the training set data
- Try Regulariszation
- Try a different neural network architecture
Bias: b(f̂) = E(f̂)- f
Variance: Var(f) = E[(f - E(f))²]
- Low Bias and High Variance (overfitting).
- The Variance is greater than bias which is a Variance problem: we need to lower the variance.
- High Bias and Low Variance (underfitting).
- The Bias is greater than Variance which is a Bias problem: we need to lower the bias.
## Effect of Bias and Variance on the Total Error of a Model
The relation between the bias, variance, and total error can be explained by the following graph [1].
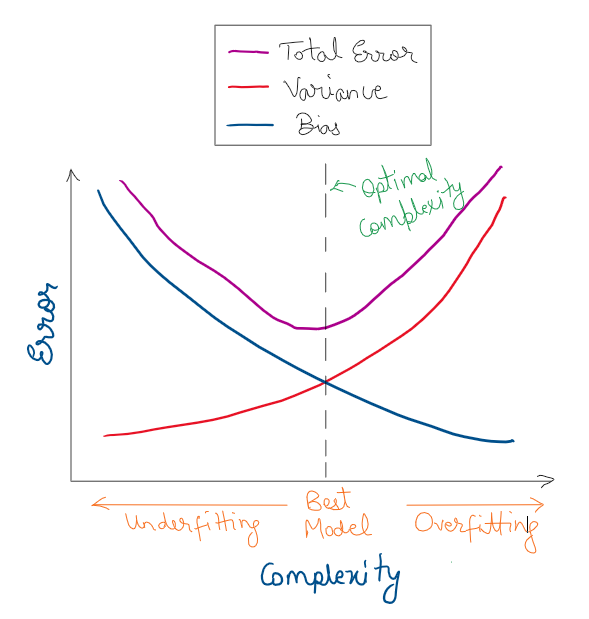
The x-axis represents the complexity of our model and the y-axis is the error value [1].
- As the complexity of the model increases, the bias decreases and the variance increases.
This is because if the model becomes larger and larger its capacity to represent a function goes on increasing. In fact, if you make the model large enough, it can memorize the entire training data leading the error to zero (if the Bayes error is zero).
However, having an overly complex model will lead to poor generalization even though you will get good training performance which is called _overfitting_.
- If the model is too simple, it will have a very high bias and low variance.
The error would be very high even for the training samples. If you observe that even after a lot of epochs, your model still has poor training data performance, it likely means that either your data has corrupt labels or the model is not complex enough to approximate the underlying function which is called _underfitting_.
- The total error continues to decrease until the _optimal complexity point_ which is where only the Bayes Error is left and the model has the maximum performance.
The optimal complexity point is where we achieve the right balance between the bias and variance at this particular point.
Here are a few examples of how under-fitting, optimal-fitting and over-fitting:
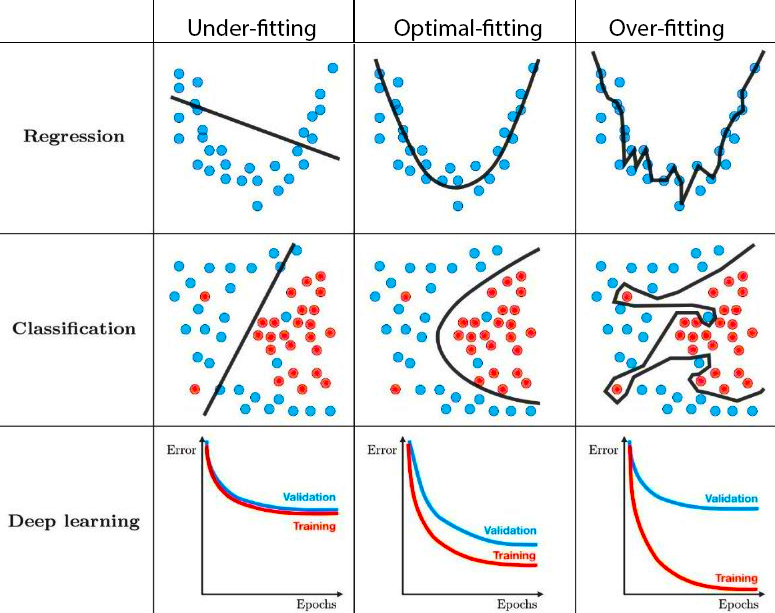
For models with high variance (rightmost column), we can see that the underlying noise is also captured which leads to awesome training performance, but terrible test performance since the generalization is poorest in this case.
For models with high bias (leftmost column), the model is not able to capture the underlying pattern in the data, so the model performs poorly even on the training data.
The optimal model is the best model and is the most generalizable since it has the right amount of bias and variance.
## References
[1]: [Bias Variance Trade-off](https://towardsdatascience.com/bias-variance-trade-off-7b4987dd9795?gi=ded88857d791)
[2]: [Bias-Variance Tradeoff](https://towardsdatascience.com/the-bias-variance-trade-off-explained-practically-in-python-48cf29d9e900?source=rss----7f60cf5620c9--data_science)
[3]: [Bias and Variance in Neural Network](https://medium.com/buzzrobot/bias-and-variance-11d8e1fee627)
[4]: [Effect of Bias in Neural Network](https://www.geeksforgeeks.org/effect-of-bias-in-neural-network/)
----------
[Bias-Variance Tradeoff in Time Series](https://towardsdatascience.com/bias-variance-tradeoff-in-time-series-8434f536387a)
[Lasso and Ridge regression: An intuitive comparison](https://towardsdatascience.com/lasso-and-ridge-regression-an-intuitive-comparison-3ee415487d18)